Contents
CudaPAD - CUDA Assembly Viewer
See the original CodeProject article here.
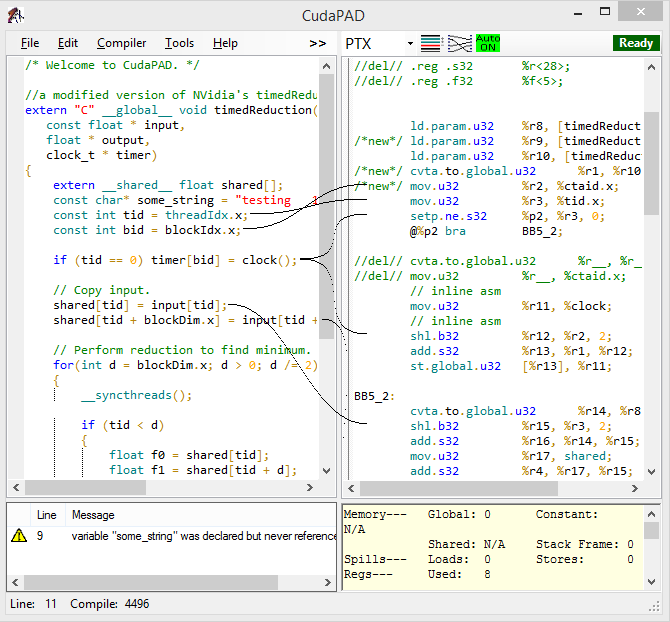
CudaPAD aids in optimizing and understanding nVidia's CUDA kernels by displaying an on-the-fly view of the PTX/SASS that makes up the GPU kernel. CudaPAD shows the PTX/SASS output with several visual aids to help understand how minor code tweaks or compiler options can affect the PTX/SASS.
What is CudaPAD?
Paste your CUDA C++ code in the left window and cleaned-up assembly will show up on the right side. Every time a small change is made to the source code window it automatically starts re-compiling (with an indicator) and displays the updated assembly on the right. In the top menu, the compiler options can be tinkered with to see how it impacts the assembly.
It also has some visual helpers. It will do a "diff" on the code with each change so the user can see what exactly changed. Also, matching the source code on the left window to the assembly on the right can be a daunting task so I added little visual lines that connect the two. Colorful highlighting was added to make the code and assembly easier to read. It also had register highlighting. A user could click on a register, and it would show up on the right. Also, raw assembly is pretty messy, so it strips out the junk for you.
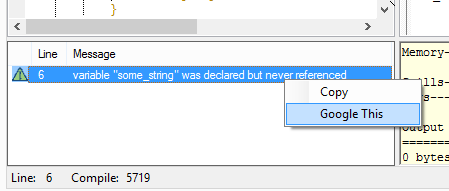
It also has some tools. I made it so when you click on the error it would show you right where the issue is with the source code. Also, when right clicking it would do a Google search on the error.
Introduction
What is PTX or SASS anyway? nVidia's PTX is an intermediate language for nVidia GPUs. It is more closely tied to pure GPU assembly (SASS) but slightly abstracted. PTX is less tied to the specific hardware or a hardware generation which makes it more useful in most cases when compared to assembly. One item it abstracts is physical register numbers which make it easier to use than the raw assembly. PTX instructions are usually translated into one or more actual SASS hardware instructions. SASS is hardcore assembly. It is what the GPU actually runs and is directly translated into machine code. Viewing SASS code is more difficult but it does show exactly what the GPU will do. As mentioned, SASS code also works with the registers directly so there is more control where registers are stored but it's another item that the programmer needs to keep track of and makes SASS more difficult to work with.
Often when programming in CUDA, there is a need to view what a kernel's PTX/SASS might look like and CudaPAD helps with this. There might be a need to view PTX/SASS for debugging, understanding what's happening, to squeeze a little more performance out of a kernel, or just for curiosity. To use the application, simply type or paste a kernel in the left panel and then the right panel will display the corresponding disassembly information. Visual informational aids like visual CUDA-to-PTX code matching lines, PTX cleanup, WinDiff, and quick register highlighting are built-in to help make the PTX easy to follow. Other on-the-fly information is also displayed like register counts, memory usage, and error information.
With any piece of code, there are often several ways to perform the same thing. Sometimes, just modifying a line or two will lead to different machine instructions with better registers and memory usage. Have fun and make some changes to a kernel in the left window and watch how the PTX/SASS changes on the right.
Background
Like most of my projects, this one was grown out of a personal need. For some algorithms I develop, GPU efficiency is essential. One way to help with this is by understanding the low-level mechanics and making any necessary adjustments. Before creating this app, I would often get in this loop where I would write a critical performance kernel then view the PTX/SASS over and over using command line tools. Doing this repetitively was time-consuming so I decided to build a quick C# app that would automate the process.
It started out as a simple app that would take a kernel in the left window and then output the PTX to the right side window. This was accomplished by basically running the same command line tools as before, mainly nvcc.exe, but now in an automated fashion in the background. I got carried away however and within a short period of time, I started adding several features including automatic re-compiling, WinDiff, visual code line markers, compile errors, and register/memory usage.
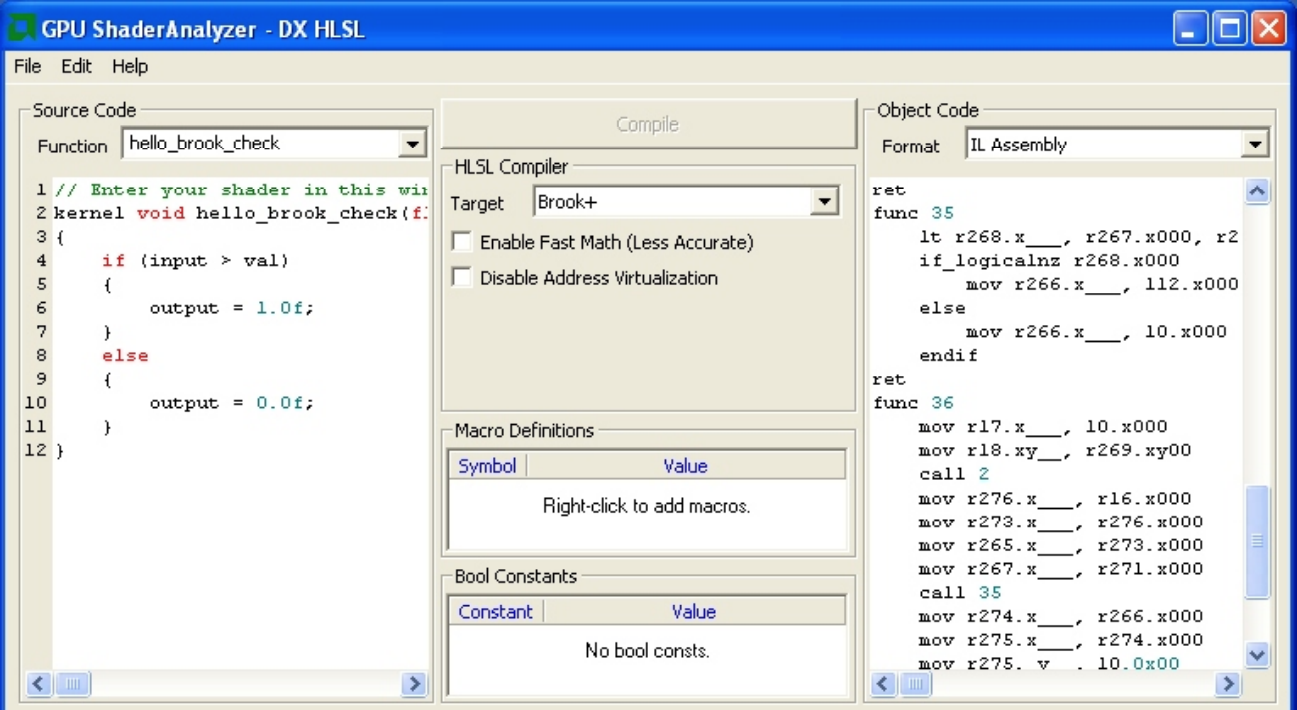
AMD used to have a similar tool for Brook++ and this gave me the idea of having the two window app back in 2009 when I first built it. The tool had a left window where a Brook+ kernel could be added and a right window where the assembly would output to. A button could be clicked to update the output window. AMD has had a couple of these over the years but it has since been replaced with AMD's CodeXL.
AMD's CodeXL and nVidia's NSight have since replaced many tools like these however CudaPAD still has its place for quick, on the fly viewing of low-level assembly and experimentation. Both CodeXL and NSight are professional grade free tools and are a must-have for GPU developers.
Using CudaPAD
Requirements
CudaPAD is simple to use. But before running it, make sure these system requirements are met:
Visual Studio 2017/2019 (Express/Community editions are okay)
A dedicated GPU is not required since we are only compiling code and not running anything.
If the requirements are met, then simply launch the executable. When CudaPAD loads, it will have a sample kernel. The sample provides a quick place to start playing around or even a starting framework for a new kernel. Whenever the kernel on the left is edited, it will update the PTX or SASS on the right. If there is a compile error, it will show that near the bottom.
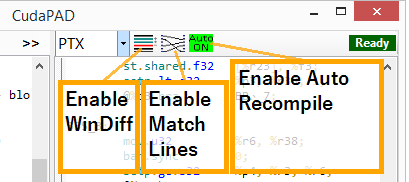
There are several features that can be enabled/disabled. All are on by default (also see Features section).
PTX/SASS View Modes
Change the drop-down textbox between PTX, SASS or SOURCE views.
PTX view
Shows the PTX intermediate language output of the kernel. PTX is close to SASS hardware instructions but is slightly higher level and is less tied to a particular GPU generation. Usually, PTX instructions translate directly to SASS however sometimes there are multiple SASS instructions per PTX instruction.
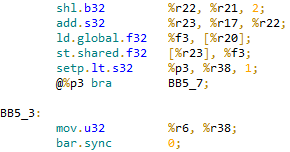
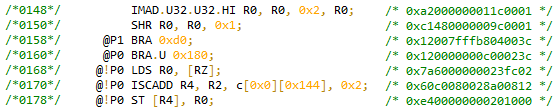
SASS view
These are true assembly instructions. These types of instructions are executed directly on the GPU. The amount of visual information supplied when viewing SASS is less than PTX – like the visual code lines do not show.
Raw code view
This view is mostly for debugging CudaPAD itself. Behind the covers, this app does not re-compile after every change. It only re-compiles when the code is modified and not comments or whitespace. The raw code is a stripped down version of the real code. The reason this was added was that I did not want it to keep compiling when I was adding/editing comments or adding/removing whitespace. This would not be resource friendly and would also throw off the WinDiff feature.
In the background, CudaPAD simply compiles the kernels with CUDA tools. The CUDA compiler then, in turn, calls a C++ compiler like Visual Studio. So to run CudaPAD, CUDA needs to be installed and most likely a C++ compiler like Visual Studio.
Enabling/Disabling Features
Features
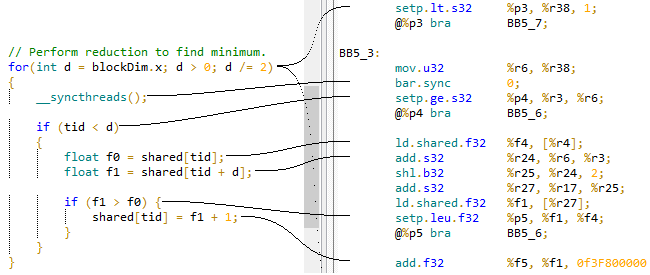
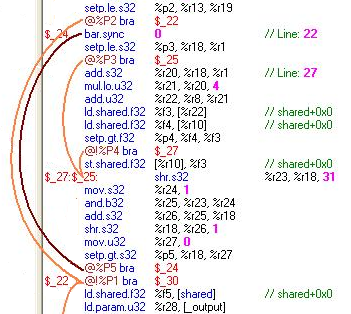
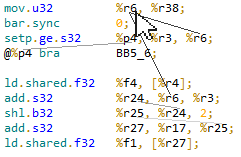
Visual Code Lines
These lines match up the CUDA source code to the PTX output. They help the programmer quickly identify what CUDA code matches up with what PTX. This function can be enabled or disabled by clicking the lines icon in the top of the PTX window.
Auto Assembly Refresh
When needed, the application will automatically re-generate the PTX code. It does not do this on each text change in the source window but rather when the stuff that matters changes. Many items are stripped from the source text that do not impact the output such as comments or spaces. The Auto Update function can be enabled or disabled by clicking the auto update icon in the top of the PTX window.
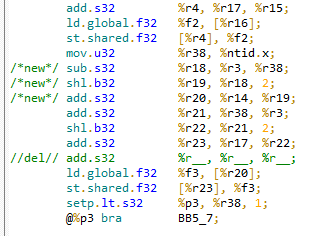
Built-in Diff Utility
Each time the output window updates, this will automatically run a differencing algorithm each time the PTX output changes. The notes are added in such a way that it does not impact the runnability of the code. I decided to add the diff information inside of comments in the event the user wants to copy and paste the code. I came up with a system of using
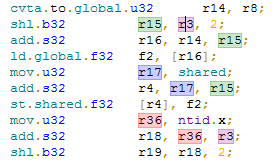
Single-Click Multiple Highlighting (new in 2016)
Just click on any register or word in the PTX window and it will highlight all instances of that item. Click on another and it will highlight those as well with a different color. Click on any highlighted item and it will un-highlight all instances of that item. With just three clicks the following can be achieved:
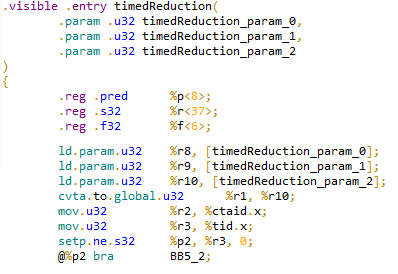
Syntax Highlighting and Output Formatting
The ScintillaNET textbox control by Jacob Slusser has some convenient text highlighting abilities that visually help when viewing code. Originally, this started out as a plain textbox, then moved to another 3rd party control and then finally to the ScintillaNET control. This results in more colorful and cleaner looking code.
Besides the text highlighting, the text in the output window is formatted so it's a little cleaner. Things like compiler information and header information are removed:
Remove unneeded comments
Remove unneeded id: comments
Remove empty "//" comments
Shorten __cudaparam_
Shorten labels
Remove .loc 15 lines (i.e. ".loc 3 3431 3")
Remove "%" in front of registers (New as of Jan. 2016)
Remove "// Inline" lines (New as of Jan. 2016)
Remove .file 1 "C:\\....." (New as of Jan. 2016)
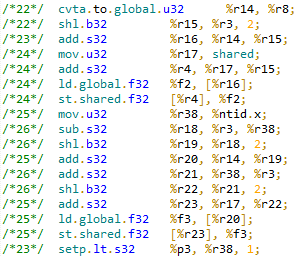
Example of highlighted and cleaned up output formatting is as follows:
Online Error/Warning Search
Often when running across an error, it is helpful to do a quick online search. I found I was often opening a browser and then copying and pasting the error into a search box. This was not efficient so I added a search online function. At the time, I think this was one of the first of its kind but since it was released in 2009, I have seen other IDEs have this.
Under the Hood
Let's take a look at how this application works. I will present what happens when the left window is edited. This triggers a recompile and then updates the right PTX/SASS window. Here it is in steps:
Advantages of Viewing PTX/SASS
Here are some advantages of viewing PTX:
Similar Programs
Godbolt Compiler Explorer
In 2019, I discovered a project very similar to this one. Matt Godbolt created software called GCC compiler explorer. Some people call this process "Godbolting" code now. I use Godbolting because that is the term everyone knows these days. Matt's program created around 2012 was web-based though but shared many features:
Both have...
Enter your code on the left window, and the ASM shows up on the right.
Automatically starts re-compiling each time a change is made in the left window.
Indicates a status that it is working in the top right.
Menus at the top to select different compiler options to compare.
Does a "diff" on the output to see what changed.
Both worked on C++ though one was CUDA C++ and the other GCC C++.
Has visuals that help the user match up the source on the left to the assembly on the right.
Used to optimize code, view what happens, and see what happens with different compiler options.
Uses colorful text highlighting.
Cleans up the assembly output code (removes assembly junk to clean it up).
When clicking a warning/error in the compiler output window it shows the user directly where the line is.
Allow users to highlight all matching registers to see all the matches quickly. (Note: added Jan. 2016 by me)
A tool in the ATI/AMD Brook++ GPGPU toolkit in 2008
There is not much online anymore but I did find a screenshot. I can't find much about this anymore but it was a C++ modified language for GPU development and a set of tools created by a university as I recall. One of the tools in it was a small app where a user can enter in code on the left side and in the middle there was a button that can be pressed that updated the assembly on the right side. This is where I got my idea from. It didn't however have highlighting, compiler options (as I recall), automated updates, visual lines to match up the code on the left to the assembly on the right, diff, cleanup (as I recall), etc.
Videos updated in 2016
Below is a quick tutorial video. The sub-menu options did not show properly in the video but I explain what I am clicking on so hopefully you can still follow along.
CudaPAD won a poster spot at the 2016 GPU Technology Conference. Even better than that it was also selected as one of the top 20! At the conference, I presented it to an audience of around 100-150 people on April 4th, 2016.
Points of Interest
I had a little fun creating this. This is probably why so much time was put into this.
Getting the code lines to work was exciting for me. I believe the visual code lines might have been one of the first of their kind when I built this in 2009 but I am not sure. This was a wild idea I had and I was not sure if I could get it working. Drawing moving lines on the screen is not that easy as I found out as there always seemed to be some side effects. Drawing the spline was the easy part but all the miscellaneous stuff like cleaning it up was more difficult. Another difficult part was calculating the location in the text box. The textbox line height and line number must be known for each spline drawn. I'm not a graphics developer so I am just happy to get it to work! The visual lines turned out better than expected and are fun to play with.
Wish List
At the time, I dreamed up many different "line" ideas to help break down the assembly but none of the others have been implemented yet:
Upward jumps are in a lighter color and downward jumps are in a darker color.
Click on a register and it would display lines where a register impacts. Dark lines for the actual places the register is used. Gray for registers it impacts. And light gray for registers it impacts after two instructions. This would have been similar to Excel's Trace Precedents / Trace Dependents function.
One other feature that I wanted to create but never got a chance to would have been a registers used function. This really helps understand where a kernel is maxing out on the register usage and often limits a kernel. When a register is used for the last time, it is freed after that instruction.
Here are some wish list items I have that may or may not be added in the future:
Isolate the implementation code from interface code using the bridge pattern. While the GUI and code are somewhat split into different files right now, they are not really separable. It's often good practice to split this up.
Add the ability to execute the code for timing purposes. Right now PTX can be visually looked at but not benchmarked.
Add a per-line register usage counter. Basically what this would require is to keep track of how many variables are being used on each PTX line. A GPU has a fixed number of registers and knowing where the register pressure is highest can help programmers balance their code. This is something I added into my AMD GPU compiler, ASM4GCN, but have not added it here.
Add jump lines to the PTX so one can easily see where jump statements land.
A Special Thanks to...
Diff functionality - This is a nice drop-in C# file that provides quality diff functionality. Originally created by Eugene Myers in 1986; Converted into C# by Matthias Hertenstein. The mostly un-edited source is in the file Diff.cs.
ScintillaNET - This nice tool provides the text highlighting for this project. It is a Windows Forms control, wrapper, and bindings for the versatile Scintilla source code editing component. It really adds a lot of life to this project.
nVidia - In 2016, CudaPAD won a spot on a CudaPAD poster at the 2016 GPU Technology Conference. Moreover, it was selected as an honorable mention (top 20). I presented it to an audience of around 100-150 people on a super large projector screen. It was a wonderful experience - one of the best I ever had.
History
| Date | Update |
|---|---|
| Dec 2008 | Initially built and it has remained mostly unchanged since 2020. |
| Aug 2009 | Built Cudapad.com website as a group project while at CSUEB - it remained up one year until it expired. |
| Jan 2013 | Changed the code textbox to use ScintillaNET for better syntax highlighting |
| Nov 2014 | Updated for nVidia CUDA 6.0/6.5 |
| June 2015 | Code released to the public; changed to MIT License; updated for CUDA 6.5/7.0 |
| Jan 2016 | Added a single-click multiple highlighting search feature; Updated for CUDA 7.0/7.5. |
| Jan 2017 | Verified okay with CUDA 8.0 |
| Jun 2019 | Updated for CUDA 10 and Visual Studio 2017/2019 |